In Situ Visualization of Blood Flow
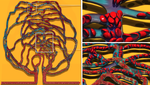
 In situ visualization of blood flow from coupled LAMMPS and Palabos simulation. The different colors of the mesh for the Red Blood Cells indicate how the data is distributed across processes.
In High Performance Computing (HPC), there is a widening gap between the rate at which we can compute data and the rate at which we can save that data to disk. To address this gap, and potential lost science, the HPC community has invested much time and effort in developing in situ technologies for analyzing and visualizing simulation data while it is still in memory, before it is discarded. Along with our collaborators at Argonne National Laboratory’s Leadership Computing Facility (ALCF) and Northern Illinois University’s Department of Mechanical Engineering the ddiLab has been investigating in situ visualization and data analysis of arterial blood flow simulations. This is enabled by leveraging SENSEI, an open-source, generic in situ interface. Starting with simulations which couple the Large-scale Atomic/Molecular Massively Parallel Simulator (LAMMPS) and Parallel Lattice Boltzmann Solver (Palabos) codes, we instrument the application with SENSEI, and perform visualization on the resulting data while those simulations are still running.
The image above illustrates an early success of this endeavor. It is a simulation of red blood cells (RBCs) moving through a simple tube geometry. The different colors of the RBCs indicate how that data is distributed across multiple processes. With this proof of concept experiment complete, we will apply this same technique to much larger, more complex simulation domains.
The ddiLab In Situ Visualization and Analysis Team:
This work was supported in part by the Director, Office of Science, Office of Advanced Scientific Computing Research, of the U.S. Department of Energy under Contract DE-AC02-06CH11357, through the grant “Scalable Analysis Methods and In Situ Infrastructure for Extreme Scale Knowledge Discovery”.